Performance profile
New in Almin 1.4.0+
You can profile the following the events using the browser developer tool timeline.
- Execute UseCase
- Read/Write StoreGroup
- Update Store
The example of profiling result.
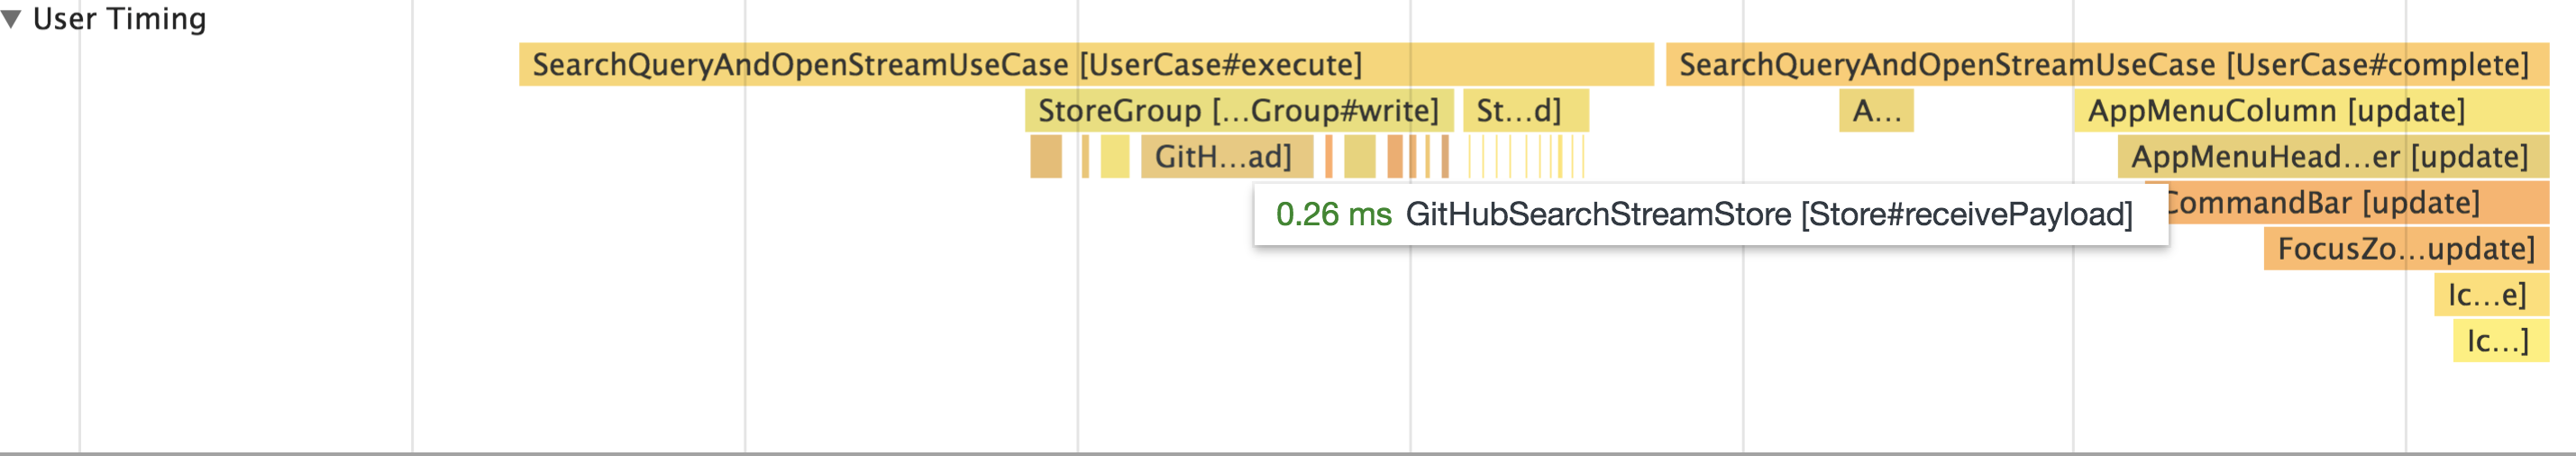
Metrics
Performance profile metrics.
| Mark | Duration |
|---|---|
[Transaction] | From begin to end of Context#transaction |
[StoreGroup#read] | StoreGroup reads state from all stores(Total of Store#getState) |
[StoreGroup#write] | StoreGroup writes payload to all stores(Total of Store#receivePayload) |
[Store#getState] | The time is spent of Store#getState for each Store |
[Store#receivePayload] | The time is spent of Store#receivePayload for each Store |
[UserCase#execute] | From will execute to did executed for each UseCase |
[UserCase#complete] | From did execute to complete for each UseCase |
Note 1: [UserCase#complete] is long
It it expected result. Because each UseCase have been completed by async.
For more details, See UseCase LifeCycle document.
Note 2: Some metrics require strict mode
[StoreGroup#write] and [Store#receivePayload] require strict mode compatible Store implementation.
In other words, you should implement receivePayload on your Store.
For more information about life-cycle, see following:
How to use?
You can turn on performance profile by performanceProfile option.
const appContext = new Context({
    dispatcher: new Dispatcher(),
    store: yourStoreGroup,
    options: {
        strict: true,
        performanceProfile: true
    }
});
If you want to turn on the performance profile only in production, you can use process.env.NODE_ENV.
const appContext = new Context({
    dispatcher: new Dispatcher(),
    store: yourStoreGroup,
    options: {
        strict: true,
        performanceProfile: process.env.NODE_ENV !== "production"
    }
});
Steps
- Turn on
performanceProfileoption - Load your app
- Open the browser DevTools "Performance" tab and press Record
- For more details, See Chrome's Timeline Tool document and MSEdge's F12 devtools guide
- Stop the recording
- Almin events will be grouped under the User Timing label